
LPIS Sustainability Compass (click here to access)
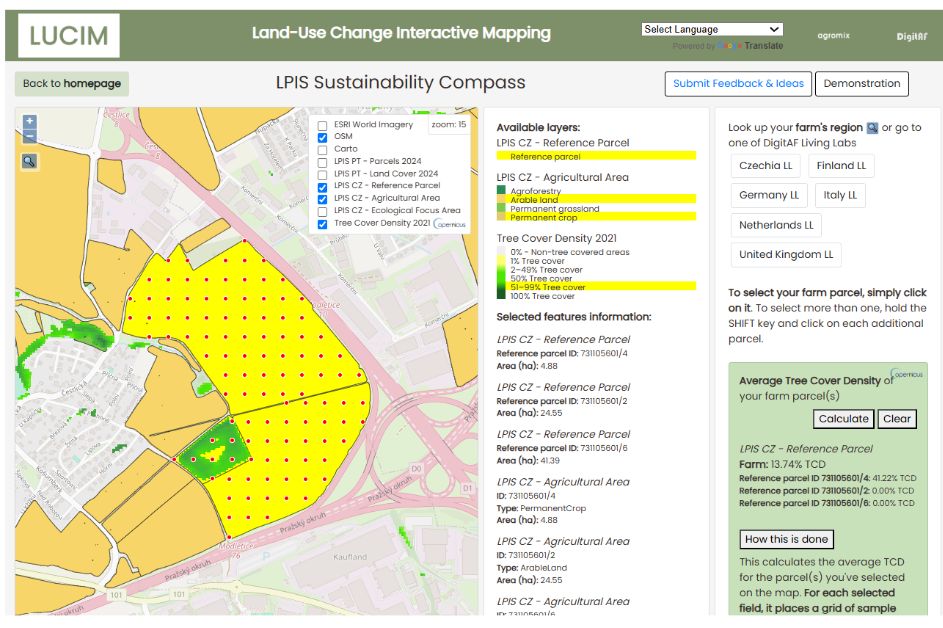
LPIS stands for "Land Parcel Identification System and the «LPIS Sustainability Compass», is an online spatial tool (under continuous development and improvement) that provides a focal point to available LPIS data, provided via Web Feature Service (WFS), integrated with Copernicus data (provided via its API) while delivering seamless, on the fly, calculated statistical insights from these datasets related to the selected LPIS plot/farm data, and providing unique contextual data about other plots/farms in the neighborhood from Copernicus services (and other permalink open access data).
The LPIS Sustainability Compass is part of a deliverable (Tomás et al. 2025) in the Horizon Europe project DigitAF (2022-2026) and aims to facilitate upscaling of results from parcels and farms to catchment and local-government scales and to contribute to the “On-farm Sustainability Compass” advocated in the recent DGAGRI “Vision for Agriculture and Food”.
The code for the «LPIS Sustainability Compass» is publicly available and open to contributions on GitHub at https://mvagroecology.github.io/lucim/lpis-sustainability-compass. The tool can be accessed and tested through its web interface at https://mvagroecology.github.io/lucim/lpis-sustainability-compass and will be updated with feedback from the living labs where the tool is to be tested, as well as further developments suggested by stakeholders.
GIS data
The base data for the analysis is sourced from the LPIS system, provided through Web Feature Service (WFS) public URLs. Data such as farm location, parcel boundaries, land use, and crop types are amongst the key elements made available and are essential for further analysis. DigitAF, particularly within Milestone 6 – Availability of LPIS data (Lawson et al. 2025), has made an effort to consistently gather and highlight good practices among national initiatives that aim to make these systems publicly accessible, in line with the INSPIRE Directive, making the case for its increased openness by all Member States - with coordinated coding of crops, land uses and environmental designations. Unfortunately, there are still several steps to be taken - while some countries lead with highly accessible and data-rich datasets, others have yet to implement the directive at all.
Methodology
All data is loaded through web geo-services such as WFS, WMS (Web Map Service for image data), and XYZ Tiles (for tiled raster images). This approach offers several advantages, e.g. no data needs to be stored locally nor on the app server, avoiding server storage limitations and maintenance overhead. Furthermore, it ensures that users have access to the most up-to-date data available from the source.
A drawback of the tool is its dependence on the reliability of external data endpoints. Any changes or interruptions on these services can potentially break map layers, disrupt analyses, or cause calculation errors. To mitigate these risks, the system continuously monitors endpoint availability through regular pings and implements redundancy by sourcing some data layers from multiple datasets. This balance helps maintain reliability while benefiting from the flexibility of real-time data access.
Through this approach, any dataset made available via web geo-services can be integrated and used within the «LPIS Sustainability Compass». The tool can incorporate several datasets from the Copernicus Land Monitoring Service portfolio. Currently showing Tree Cover Density at 10m resolution, but additional datasets are under consideration, also depending of living labs feedback.
This tool, despite available (open access and open source, is under continuous development. Feedback is certainly welcome. Please use the "Submit Feedback and Ideas" button in the tool.